Last updated: September 2026
When facility managers compare floor-cleaning options, the price tag on the machine is the least important number on the page. The number that actually decides the budget is Total Cost of Ownership (TCO) — what it costs to keep a large floor clean, every single day, for the next five years. The number that gets the capital approved is ROI: how many weeks of operation it takes before the machine has paid for itself.
This guide covers both, and integrates them into a single financial model. It compares manual mopping, walk-behind scrubbers and ride-on floor scrubbers using industry-standard productivity benchmarks, builds a full five-year TCO case, then stress-tests it with payback, sensitivity and conservative-scenario analysis. It closes with the operational factors — safety, consistency, staffing stability — that never fit neatly into a spreadsheet but decide whether an equipment programme actually survives rollout.
The short version: manual mopping costs roughly US$0.072 per m² per cleaning cycle in labour alone. A mid-size ride-on scrubber costs roughly US$0.006 per m² — about 12× less — before you account for the machine’s own operating cost. Break-even arrives at around 300–450 m² of daily scrubbed floor, and payback typically lands inside two months. Almost every industrial facility passed that threshold years ago.
To keep the arithmetic honest, this article models two reference facilities, because a single area assumption hides more than it reveals:
- Facility A (TCO reference): 10,000 m² indoor floor, cleaned once per day, 300 days per year, US$18/h fully loaded labour.
- Facility B (throughput reference): 20,000 m² distribution centre with 8,000 m² of active floor cleaned five days a week, 260 cleaning days per year, US$18/h fully loaded labour.
Every assumption is stated so you can substitute your own. Where a figure is theoretical or illustrative, it is labelled.
2. The hidden cost of manual cleaning
Manual cleaning looks free because the mop is already in the closet. In reality, labour accounts for 80–90% of the total cost of floor care. Chemicals, pads, brushes and water are rounding errors. Capital equipment is a single-digit percentage of a five-year budget. The line that actually decides whether a floor-care programme is affordable is the invisible one: operator hours per square metre, multiplied by every cleaning cycle you run in a year.
Ask a facility manager what floor care costs and the answer is usually a purchase price — a mop and bucket, a few cases of chemicals, an hourly wage. Ask a procurement director and the answer is an annual contract value. Both answers understate the number, because both stop at the invoice and ignore the multiplication.
A mopping crew and a ride-on scrubber can produce a comparable finish. They cannot produce a comparable throughput — and throughput is what you are actually buying.
2.1 Four cost drivers that are routinely underestimated
- Labour intensity: A single cleaner with a mop and bucket covers roughly 200–400 m² per hour on a good day — and that figure drops sharply on large open floors where workers spend more time walking back to the bucket than actually cleaning. A large distribution centre may need a five- or six-person night crew to mop the floor a single ride-on operator can scrub in two hours.
- Inconsistent chemistry: Mop water becomes dirty within minutes. Operators compensate by pouring in more detergent, which leaves sticky residue that attracts new dirt — a textbook example of re-cleaning the same square metre twice, and a hidden driver of chemical spend.
- Safety, strain and turnover: Repetitive mopping causes strain injuries, and high staff turnover means constant re-training. Slip-and-fall incidents on damp, unevenly mopped floors add insurance and liability costs that never appear on a cleaning invoice.
- Non-productive time: Refilling, dumping, transporting equipment, changing pads and repositioning around racking and MHE traffic all consume attended hours. Vendors quote productive rates; budgets pay for effective ones. The difference between the two is where manual cleaning quietly becomes the most expensive option on the table.
3. Productivity benchmarks: how much floor can each method clean?
Any ROI or TCO comparison lives or dies on the productivity assumption, so start there — and be strict about what “productivity” means. Two rates matter, and confusing them is the most common error in cleaning business cases:
- Productive rate — m² per hour while the operator is actively working the floor.
- Effective rate — m² per hour averaged across the whole attended period, including refilling solution tanks, dumping recovery water, transporting equipment, changing pads, and repositioning.
Effective rate is the only number that belongs in a budget.
3.1 Effective throughput by method
| Method | Working width | Productive rate (m²/h) | Typical non-productive allowance | Effective rate (m²/h) |
|---|---|---|---|---|
| Mop & bucket, manual | 40–60 cm | 280–350 | 20–30% (refills, dumping, bucket handling) | 200–300 |
| Manual dust mop + spot mop | 60–90 cm | 300–450 | 15–25% | 250–400 |
| Walk-behind scrubber (EN500H class) | 50–70 cm | 2,000–2,400 | 10–25% (tank stops, cable/battery swaps) | 1,500–2,000 |
| Ride-on scrubber, mid-size (EN700S class) | 70–110 cm | 3,200–3,600 | 12–18% (dump & refill, travel) | 3,000 |
| Ride-on scrubber, heavy-duty (EN870D / EN900 class) | 90–120 cm | 5,000–5,500 | 10–15% | 4,500 |
| Ride-on sweeper (SP1250 class) — sweeping duty only | 125–140 cm | 6,500–8,500 | 10–15% | 6,000–8,000 |
Figure note: the ride-on rates above are consistent with OLIFT’s published platform data (EN700S rated at 3,000 m²/h; the SP1250 sweeper at 6,000–8,000 m²/h on open warehouse floors). Effective rates assume a single operator, an unobstructed aisle layout, and a floor in routine condition — not a post-construction clean. Ranges are drawn from cleaning-industry association and equipment-manufacturer benchmarks.
The productivity gap is not incremental — it is structural. A ride-on scrubber cleans 12–25× more floor per hour than a mop.
3.2 The same job, converted to operator hours
Apply those rates to Facility B: 8,000 m² of daily scrubbed floor — a realistic active area for a 20,000 m² distribution centre where racking, docks and yard consume the balance.
| Method | Effective rate | Operator hours per day | Operators required (8 h shift) |
|---|---|---|---|
| Mop & bucket | 250 m²/h | 32.0 h | 4 operators |
| Walk-behind scrubber | 1,800 m²/h | 4.4 h | 1 operator |
| Ride-on scrubber, mid-size | 3,000 m²/h | 2.7 h | 1 operator |
| Ride-on scrubber, heavy-duty | 4,500 m²/h | 1.8 h | 1 operator |
Read that third column again. The manual method consumes 32 operator-hours a day to do what a mid-size ride-on scrubber does in 2.7. That is not an incremental difference — it is a difference of an entire labour roster.
3.3 The same job on Facility A (10,000 m²)
| Cleaning method | Effective productivity | Hours per 10,000 m² | Labour cost per day | Annual labour cost (300 days) |
|---|---|---|---|---|
| Manual mop & bucket | 250 m²/h | 40 h | $720 | $216,000 |
| Walk-behind scrubber | 1,900 m²/h | 5 h | $90 | $27,000 |
| Ride-on scrubber | 4,300 m²/h | 2.3 h | $42 | $12,600 |
Move from manual cleaning to a ride-on machine here and the annual labour bill falls from $216,000 to roughly $12,600 — before a single consumable is counted.
3.4 The metric that travels: cost per square metre
Labour rates vary by market, so the most portable figure is cost per m² per cleaning cycle. At a fully loaded labour cost of US$18.00/hour (wages, benefits, supervision overhead — a defensible mid-band for US, UK, German and Singapore industrial markets; the band runs roughly US$12–28), the numbers for Facility B are:
| Method | Labour cost per m² per cycle | Annualised labour cost per m² (260 cycles) | Relative cost |
|---|---|---|---|
| Mop & bucket | US$0.0720 | US$18.72 | 1.0× (baseline) |
| Walk-behind scrubber | US$0.0100 | US$2.60 | 7.2× lower |
| Ride-on scrubber, mid-size | US$0.0060 | US$1.56 | 12× lower |
| Ride-on scrubber, heavy-duty | US$0.0040 | US$1.04 | 18× lower |
This is the single most important table in the guide. The cost of manual floor cleaning per square metre is not a rounding difference — it is an order-of-magnitude difference. A facility that benchmarks its cleaning spend per m² can identify an over-reliant manual programme from the metric alone, without ever seeing the crew.
3.5 Why manual throughput cannot be improved enough to close the gap
The instinctive objection: “we can mop faster, or hire better.” That lever has a ceiling.
- Human output is capped by the tool. A 60 cm mop head covers roughly 0.5 m² per pass at working pace. Even at elite productivity — 400 m²/h — the manual class remains 7–11× slower than a ride-on scrubber rated at 3,000–4,500 m²/h, which covers a 70–110 cm scrubbing path in a single pass with simultaneous solution delivery, agitation, recovery and drying.
- Manual work adds safety-linked pauses. Wet-floor signage, segregating pedestrian routes from forklift lanes, and moving buckets out of traffic all cost time that never appears in a productivity quote.
- Adding people does not scale linearly. Four mop operators consume four wages, four sets of consumables, four supervisors’ attention and four sets of workplace risk. One scrubber operator consumes one of each. Any cost model that treats labour as a variable with no management overhead understates manual cost.
- Manual work cannot be scheduled into a shrinking window. If your cleaning must finish before the 06:00 shift start, 32 operator-hours of mopping is a hard constraint on throughput. 2.7 hours is not.
4. Financial analysis: TCO, savings, payback and break-even
With throughput established, the business case becomes arithmetic. This section builds the Total Cost of Ownership model first, then converts it into annual savings, payback period, ROI and break-even thresholds. Unless stated otherwise the model uses Facility B: an 8,000 m² daily scrub, 260 cleaning days per year, mid-size ride-on scrubber (EN700S class), US$18.00/h fully loaded labour.
4.1 What a credible TCO model must contain
A TCO model has to include everything, not just the invoice price. Five cost buckets, applied identically to every option:
- Acquisition: purchase price, batteries, charger, squeegee and brush tooling.
- Labour: hours × hourly cost, including supervision and re-training.
- Consumables: detergent, pads and brushes, and replacement mop heads.
- Water & energy: mopping typically consumes far more water per square metre than a metered scrubber that recovers its solution.
- Maintenance: scheduled service, wear parts, downtime and lost productivity.
4.2 Five-year TCO, side by side (Facility A)
Applying those five buckets to the 10,000 m² facility over a five-year horizon produces a striking result:
| 5-year cost component | Manual mop | Walk-behind scrubber | Ride-on scrubber |
|---|---|---|---|
| Equipment (one unit) | $800 | $8,000 | $20,000 |
| Labour (300 days × 5 years) | $1,080,000 | $135,000 | $54,000 |
| Chemicals & consumables | $30,000 | $12,000 | $9,000 |
| Maintenance & wear parts | $5,000 | $15,000 | $18,000 |
| Total 5-year TCO | $1,115,800 | $170,000 | $101,000 |
| Cost per m² cleaned (5 years) | $0.074 | $0.011 | $0.007 |
Note the inversion that the TCO view exposes: the ride-on machine carries the highest acquisition line and the highest maintenance line, and still finishes 11× cheaper than manual mopping over five years. Equipment price is roughly 2% of manual TCO and roughly 20% of ride-on TCO — which is why purchase price is the worst possible basis for this decision.
4.3 Annual labour cost: manual vs machine (Facility B)
| Line item | Manual (mop & bucket) | Ride-on scrubber (mid-size) |
|---|---|---|
| Effective rate | 250 m²/h | 3,000 m²/h |
| Operator hours per day | 32.0 | 2.7 |
| Operator hours per year (260 days) | 8,320 h | 694 h |
| Annual labour cost at US$18/h | US$149,760 | US$12,480 |
| Headcount equivalent | 4 FTE cleaners | 1 machine operator |
| Gross annual labour delta | — | US$137,280 |
4.4 Charging the machine for what it consumes
Manual cleaning debates usually stop at the labour line. A credible TCO case must also charge the machine for what it consumes.
| Machine cost component | Annual cost (indicative) | Basis |
|---|---|---|
| Electricity / battery charging | US$200–400 | 24 V / 100 Ah maintenance-free pack, ~1 charge per shift duty cycle |
| Water & chemical dosing | US$300–500 | 81 L solution tank, ~1.5 tanks/day, metered dosing |
| Wear parts — brushes, squeegees, pads | US$300–500 | Brush set every ~800–1,200 h; squeegee blades annually |
| Planned maintenance (labour + consumables) | US$500–900 | Scheduled service, seals, filters, hoses |
| Battery replacement amortised | US$150–250 | Replacement in year 4, spread across asset life |
| Total annual operating cost | US$1,450–2,550 | Excludes operator labour (counted in 4.3) |
Total annual cost of ownership (5-year straight-line), Facility B:
| Operator labour | US$12,480 |
| Machine operating cost (mid-band) | US$2,000 |
| Asset depreciation (US$18,000 indicative factory-direct CAPEX ÷ 5 years) | US$3,600 |
| Total | US$18,080 |
| Comparison: manual programme | US$149,760 |
| Annual net saving | ≈ US$131,680 |
4.5 Payback period and ROI
Because labour dominates the equation, payback on a ride-on scrubber is measured in weeks, not years.
| Measure | Facility B (8,000 m²/day, 260 days) | Facility A (10,000 m²/day, 300 days) |
|---|---|---|
| CAPEX (specification-dependent) | US$12,000–22,000 | US$20,000 |
| Net saving per day | ≈ US$506 | ≈ US$684 |
| Monthly net saving | ≈ US$10,970 | — |
| Simple payback period | ≈ 1.6 months (6–7 weeks) | ≈ 29 operating days |
| Year-1 ROI on capital | ≈ 730% | ≈ 800% |
| 3-year ROI | ≈ 2,100% | ≈ 2,500% |
| 5-year net position | ≈ US$640,000 ahead of manual | ≈ US$1,000,000 ahead of manual |
Even the incremental upgrade from a walk-behind to a ride-on machine — an extra $12,000 — pays for itself in around seven months of daily operation. After that, every hour the machine runs is pure operating profit.
Even if you deliberately stress-test the model — halving the labour saving, doubling the CAPEX — the floor scrubber ROI case remains positive inside the first year. That is the honest headline: for any facility scrubbing more than a few hundred square metres a day, the payback question is not whether but how many weeks.
4.6 The conservative scenarios (and why we include them)
Payback models fail in the boardroom when they assume every displaced labour hour becomes cash in the bank. It rarely does. In practice, facilities redeploy people into order-picking support, packaging, sanitation in other zones, or they cannot reduce contract headcount mid-term. So here is the same case, deliberately diluted:
| Scenario | Assumption | Annual net saving | Payback |
|---|---|---|---|
| A — Full displacement | 4 cleaners removed from the floor-care roster (contract or agency labour) | ≈ US$131,700 | ≈ 1.6 months |
| B — Partial redeployment | 2 of 4 roles removed; remaining 2 redeployed to higher-value tasks; overtime and absence cover reduced | ≈ US$66,000 | ≈ 3.3 months |
| C — Zero headcount reduction | All staff retained; savings realised only via eliminated overtime, agency cover and reduced absenteeism backfill (~20% of labour value) | ≈ US$28,300 | ≈ 7.6 months |
| D — Chronic under-cleaning | Manual programme was already rationed; machine is used to restore frequency rather than cut cost | Cost avoided on external contractor mobilisation | < 12 months |
The scenario that matters for your facility is not the best case — it is the one your HR and operations reality supports. Scenario B is the most common outcome in the deployments we model; Scenario D is the most under-discussed, because “we finally clean the floor as often as the standard requires, at 15% of the contractor cost” is a stronger argument than most cost-cutting narratives.
4.7 Sensitivity: labour rate and daily area
Gross annual savings (mid-size ride-on, 8,000 m²/day, 260 days):
| Labour rate (fully loaded) | Manual labour cost/yr | Ride-on labour cost/yr | Gross saving/yr | Net after machine costs |
|---|---|---|---|---|
| US$12/h | US$99,840 | US$8,320 | US$91,520 | ≈ US$89,500 |
| US$18/h | US$149,760 | US$12,480 | US$137,280 | ≈ US$135,300 |
| US$24/h | US$199,680 | US$16,640 | US$183,040 | ≈ US$181,000 |
| US$28/h | US$232,960 | US$19,413 | US$213,547 | ≈ US$211,500 |
4.8 Break-even: how small must the job be before manual wins?
Machine cost per day = (area ÷ 3,000) × labour rate + fixed daily cost (≈ US$20/day for a mid-size unit over 260 days). Manual cost per day = (area ÷ 250) × labour rate. Setting the two equal gives a break-even of roughly:
| Labour rate | Break-even daily scrubbed area |
|---|---|
| US$12/h | ≈ 455 m² |
| US$18/h | ≈ 300 m² |
| US$24/h | ≈ 225 m² |
Above roughly 300–450 m² of daily floor care, the machine is cheaper. Below it, manual wins. A single warehouse aisle run is typically longer than that. This is why ride-on classes — not walk-behinds or mops — dominate industrial floors above a few thousand square metres.
4.9 Where a walk-behind scrubber fits
The walk-behind class is not a stepping stone to be skipped. For congested zones, mezzanines, narrow aisles and sites with mixed floor types, a walk-behind (EN500H class) at roughly US$4,500–8,000 avoids the capital outlay of a ride-on while still delivering 1,800 m²/h effective — still 7× manual throughput, with payback typically inside one quarter. Many facilities run both: ride-on for open floor, walk-behind for the 15–20% of area that a ride-on cannot reach.
5. Beyond the spreadsheet: quality, safety, consistency and morale
The financial case is only half the story. A pure cost model undersells the change. These are the benefits that show up in audit findings, insurance premiums and staff turnover — harder to quantify, rarely absent.
5.1 Quality and consistency
Manual cleaning quality is a function of individual technique, energy on the day, and time pressure. It drifts. Machine cleaning is a function of settings, chemistry and passes — and it repeats.
- Consistent results: Recirculating brush systems apply fresh, metered solution at constant pressure, so the tenth thousand square metre is cleaned as well as the first.
- A repeatable standard: Brush pressure, solution flow and pass overlap are set once and hold across every operator, every shift. Coverage per tank becomes a measurable figure rather than an estimate.
- Uniform finish: Streaking, mop swirl and edge build-up are technique artefacts. A single water-recovery scrub path, run in overlapping lanes, produces a uniform result that survives a customer walk-through of a distribution centre or a retailer’s own-brand audit.
- Audit-ready documentation: Modern ride-on platforms generate usage and coverage data — hours run, areas covered, water and chemistry consumed. For HACCP, GMP, BRCGS and ISO 9001 / ISO 14001 site audits, “we can show coverage records and consumption per zone” ends the conversation far faster than “our cleaners are trained.”
- Predictable scheduling: 2.7 hours of attended cleaning fits before shift start; 32 does not. Consistency of timing matters as much as consistency of finish when floor care must not intersect with picking windows.
5.2 Safety
- Slip and fall exposure. Mopping leaves standing water and a wet film that must dry before traffic returns. Squeegee vacuuming removes that film, so the floor is trafficable in the same pass — a direct reduction in one of the most common and most expensive workplace claims in warehousing.
- Fewer people in the forklift interface. Four operators working across active aisles at once is four pedestrian exposures per shift, plus four sets of signs, cones and buckets in MHE traffic lanes. One machine, one operator, one geometry.
- Less manual handling. Repeated bucket lifting, wringing and dumping is a recognised musculoskeletal injury mechanism. Operators load and dump a tank at height with a designed handle rather than lifting a full 20 L bucket dozens of times per shift.
- Chemical exposure. Metered dosing from a sealed tank replaces decanting concentrate by hand, reducing splash, inhalation and skin-contact incidents.
- Lower fatigue risk. 32 operator-hours of physical mopping on a night shift is a fatigue multiplier; 2.7 hours of machine operation on a powered platform is not.
5.3 Staff morale and retention
The least-discussed ROI line, and often the most durable one.
- Work becomes acceptable work. Operators move from repetitive full-body labour to driving a machine — a role that is easier to fill, easier to retain and easier to train. Where labour markets are tight, this is not a soft benefit: it is the difference between a staffed roster and a permanent overtime bill.
- Absence and turnover fall. Physically punishing tasks correlate with higher sickness absence and shorter tenure. Reducing the load on the roster reduces the backfill cost that never appears in a cleaning budget but always appears in payroll.
- Redeployment instead of redundancy. In Scenarios B and C above, the message to the team is that the machine takes over the task, not the job. Facilities that frame it this way avoid the industrial-relations friction that stalls equipment programmes mid-rollout.
- A higher-skill roster. A ride-on operator is a machine handler with training, maintenance familiarity and a service relationship — a role facilities can promote into and pay up for, which improves the whole shift’s stability.
5.4 Environmental footprint
A scrubber with on-board recovery typically consumes 10–20× less fresh water per m² than mopping, because solution is metered onto the floor and recovered rather than carried and dumped. Metered dosing instead of hand-mixed buckets also typically cuts detergent consumption by 30–50% and reduces waste-water volume. On 8,000 m² per day, that is a material volume — and an easy win for any site reporting to an ESG framework.
6. When manual cleaning still makes sense
To be fair, mopping has not disappeared, and this guide is not an argument for removing it everywhere. Manual methods remain the right choice for:
- Small areas under roughly 500 m² (and below the 300–450 m² daily break-even in many labour markets).
- Congested corners, stairwells and mezzanines a machine cannot reach.
- Spill response and spot cleaning between scheduled cycles.
- Delicate surfaces where water volume must be tightly controlled.
The mistake is using manual cleaning as the default method for large open floors, where it is provably the most expensive option available. The right structure is almost always hybrid: ride-on for the open floor, walk-behind for congested zones, manual for edges, stairs and spills.
7. Building your own number — the 6 inputs that decide everything
Every figure in this guide comes from six variables. If you can supply these six, the arithmetic is fully determined — and it will be yours, not ours.
| # | Input | How to find it | Typical range |
|---|---|---|---|
| 1 | Daily scrubbed area (m²) | Active floor inside racking, not total building footprint | 2,000–15,000 m² |
| 2 | Cleaning days per year | Shifts × operating days | 250–312 |
| 3 | Fully loaded labour rate | Wage + benefits + supervision overhead | US$12–28/h |
| 4 | Effective manual rate | Time a crew on a known area, whole attendance period | 200–400 m²/h |
| 5 | Target finish standard | Sweep, scrub-and-dry, or deep clean | Scrub-and-dry most common |
| 6 | Machine CAPEX (quoted) | Your specification, quoted factory-direct | US$4,500–30,000+ |
Two rules when you run the numbers:
- Use effective rates for both methods. Comparing a vendor’s productive m²/h against your crew’s bad day is not a comparison.
- Show the conservative scenario first. A CFO who has seen the diluted case approve the full one. A model that only shows the best case gets audited instead of signed.
A quick reality check: if your calculated payback is under six months and your headcount cannot change, do not delete the saving — restate it as capacity. The machine released 29 operator-hours a day. That is 7,500 hours a year of labour your facility can redirect, or cleaning frequency it can finally deliver at standard.
8. Matching the machine to the facility
OLIFT builds ride-on machines around large-area TCO problems. Applying the same arithmetic to platform selection:
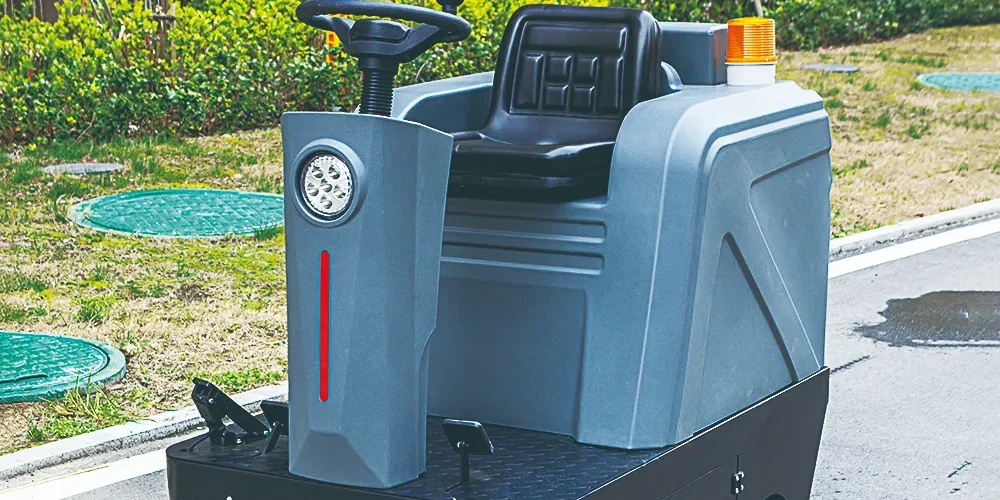
- Open floor above a few thousand m², routine condition: EN700S Ride-On Floor Scrubber — a 700 mm scrubbing deck with high-capacity solution and recovery tanks, delivering ride-on class productivity up to 3,000–5,000 m²/h for warehouses, manufacturing plants and large retail floors.
- Very large indoor and outdoor areas needing sweeping as well as scrubbing: SP1250 Ride-On Sweeper — industrial-scale coverage with a wide sweeping path and generous hopper capacity.
- Congested aisles, mezzanines and mixed floor types: EN500H walk-behind scrubber — 1,800 m²/h effective and payback typically inside a quarter.
- Heavy-duty or post-construction duty: the EN870D / EN900 ride-on range.
Choosing between them comes down to the same TCO arithmetic used above: measure the area, count the daily cleaning hours, price the labour, and let the numbers pick the machine.
9. The bottom line
Manual cleaning is not cheap — it simply hides its cost in payroll. It is expensive because it consumes 12× more operator time per square metre than a ride-on scrubber, and that time is multiplied across every cleaning day of the year. Run the manual cleaning vs floor scrubber comparison on your own floor and square metres, and the warehouse cleaning labour cost line does the deciding for you.
The arithmetic on an 8,000 m² daily floor (Facility B):
- Manual mopping: 32 operator-hours a day, 4 FTE, ≈ US$149,760 a year in labour alone.
- Mid-size ride-on scrubber: 2.7 operator-hours, 1 operator, ≈ US$18,080 a year all-in including the machine.
- Net annual saving: ≈ US$130,000 — payback on capital inside two months, and still inside a year under the most conservative assumptions.
- Break-even: manual only wins below roughly 300–450 m² of daily scrubbed floor.
- Five-year TCO (Facility A): $101,000 for the ride-on scrubber against $1,115,800 for manual mopping.
The decision, then, is not really “can we afford a machine?” It is “which of these two operating models do we want to run for the next five years?” One is a growing labour line item with a safety profile and a quality variance attached. The other is a fixed asset with a maintenance calendar and a coverage figure you can put in an audit file.
Your next step
1. Download the ROI & labour-savings calculator.
Plug in your own six inputs — area, days, labour rate, throughput, standard, CAPEX — and get your payback period, 5-year net position and cost per m² in under ten minutes. It is the same model used in this guide, with conservative scenarios pre-built.
→ Download the ROI calculator →
2. Request a quote and a machine recommendation.
Send us your daily scrubbed area, floor type and shift pattern. The OLIFT export team will return an indicative quotation for the right platform — EN700S ride-on scrubber, EN500H walk-behind, heavy-duty EN870D / EN900 or SP1250 ride-on sweeper — with a filled-in TCO and ROI sheet for your numbers. Standard models ship in 7–14 days; we deliver to 50+ countries with door-to-door freight and export documentation handled.
→ Request a quote →
3. Not sure which class fits your floor?
Tell us the aisle width, racking layout and floor finish. We will tell you honestly whether you need a ride-on, a walk-behind, or both — and which zones should stay manual. You can also compare the full commercial floor sweeper and ride-on scrubber dryer range, meet the cleaning equipment manufacturer behind the machines, or start from our industrial floor scrubber home page.
Frequently asked questions
Is a floor scrubber actually cheaper than manual cleaning?
Above roughly 300–450 m² of daily scrubbed floor, yes — decisively. Manual cleaning costs about US$0.072 per m² per cycle in labour at US$18/h; a mid-size ride-on scrubber costs about US$0.006 per m² — roughly 12× less — before its own operating cost of US$1,450–2,550 per year is applied.
What is the typical payback period for a ride-on floor scrubber?
For an 8,000 m² daily cleaning area at US$18/h fully loaded labour, simple payback on an indicative US$12,000–22,000 machine is around 1.6 months. On a 10,000 m² floor the same calculation returns roughly 29 operating days. Under a conservative scenario where only half the labour saving is realised, payback is still around 3.3 months.
What is the 5-year total cost of ownership of a ride-on scrubber vs manual mopping?
On a 10,000 m² floor cleaned once a day for 300 days a year, five-year TCO is approximately $101,000 for a ride-on scrubber ($0.007 per m² cleaned) against $1,115,800 for manual mopping ($0.074 per m²) — even though the machine carries the highest purchase price and the highest maintenance line of the three options compared.
How many cleaners does a ride-on scrubber replace?
On 8,000 m² per day, manual mopping requires approximately 4 FTE cleaners (32 operator-hours) at 250 m²/h effective. A mid-size ride-on scrubber completes the same work in about 2.7 operator-hours with one operator.
How much does manual floor cleaning cost per square meter per year?
At US$18/h fully loaded and one cleaning cycle per day for 260 days a year, manual mopping costs approximately US$18.72 per m² per year. A ride-on scrubber reduces the equivalent labour cost to approximately US$1.56 per m² per year.
How does floor scrubber ROI change with shift patterns?
It improves. Each additional cleaning cycle multiplies the manual labour cost per m² but leaves the machine’s annual fixed costs (depreciation, planned maintenance) largely unchanged. Moving from five to six or seven cleaning days a week widens the floor scrubber ROI and TCO case and shortens payback.
What drives warehouse cleaning labour cost most?
Cleaning frequency and method, not chemical or equipment spend. Warehouse cleaning labour cost is determined by scrubbed area ÷ effective throughput (m²/h) × cleaning days × fully loaded hourly rate — which is why a 12× throughput difference between mopping and a ride-on scrubber dominates every other line in the budget.
Does machine cleaning reduce water and chemical consumption?
Yes. A scrubber with on-board recovery meters solution onto the floor and recovers it, typically consuming 10–20× less fresh water per m² than mop-and-bucket methods, along with 30–50% lower detergent consumption through metered dosing.
Prepared for olift.cc — OLIFT Group, industrial cleaning equipment manufacturer. All rates, areas and cost bands in this article are illustrative model inputs, not audited results; labour rates, CAPEX and throughput vary by market and specification. Confirm current pricing and productivity claims with a live quotation for your facility.